共计 2503 个字符,预计需要花费 7 分钟才能阅读完成。
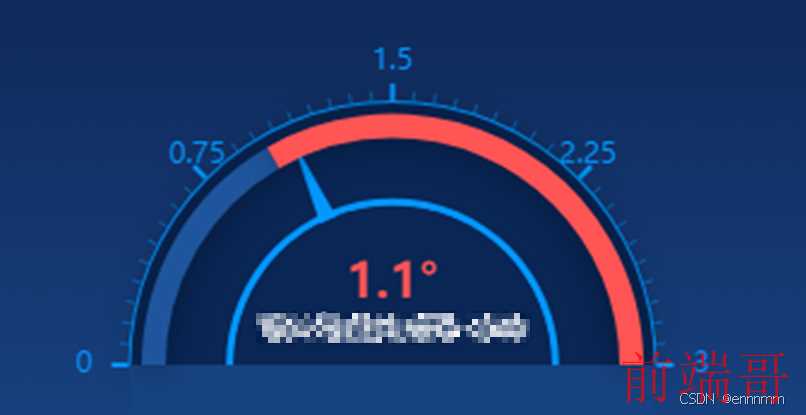
图表效果:


参考:PUE 能源效率的指标 – category-work,series-gauge 仪表盘,series-pie 饼图,title 标题 – makeapie echarts 社区图表可视化案例
图层顺序如下:
1. 因为需要一个背景色,所以用饼图作为一个背景图(可自行调整),直接设置 zlevel 为 0,即可置于最底层

2. 第二层是刻度层(zlevel=2),使用 gauge 类型图表,这里设置了仪表盘起止的角度,为什么要单独搞个刻度层呢,因为设计图的刻度和轴线是分离的,所以只能单独搞一层刻度,然后再加一层标尺的绘制(zlevel=2)


3. 然后在这基础上加上数值层显示(zlevel=1),而指针的样式与设计图又差距很大,于是在此基础上再加一个遮罩(zlevel=2),遮住中间的指针,只需要指针尾部部分,到此图表绘制完成


上配置:
halfPieOption = {
  grid: {
    left: 15,
    top: 0,
    bottom: 0,
    right: 15
  },
  title: {
    zlevel: 3,
    text: '1.67%',
    subtext: 'text',
    top: '48%',
    left: 'center',
    itemGap: 3,
    textStyle: {
      fontSize: 20,
      lineHeight: 20,
      color: '#00F3F6'
    },
    subtextStyle: {
      fontSize: 12,
      lineHeight: 12,
      color: '#fff'
    }
  },
  series: [
    {
      name: '遮罩 1',
      tooltip: {show: false},
      type: 'pie',
      radius: '100%',
      zlevel: 0,
      startAngle: 0,
      silent: true,
      center: ['50%', '70%'], // 默认全局居中
      hoverAnimation: false,
      itemStyle: {
        normal: {color: function(colors) {let color = ['#14376e', '#092655']
            return color[colors.dataIndex]
          }
        }
      },
      labelLine: {
        normal: {show: false}
      },
      animation: false,
      data: [1, 1]
    },
    {
      name: '刻度',
      type: 'gauge',
      radius: '100%',
      center: ['50%', '70%'], // 默认全局居中
      splitNumber: 4, // 刻度数量
      min: 0,
      zlevel: 2,
      max: 2,
      startAngle: 180,
      endAngle: 0,
      clockwise: true,
      axisLine: {
        show: true,
        lineStyle: {
          width: 1,
          shadowBlur: 0,
          color: [[1, highlight]]
        }
      },
      axisTick: {
        show: true,
        lineStyle: {
          color: highlight,
          width: 0.5
        },
        length: -4,
        splitNumber: 10
      },
      splitLine: {
        show: true,
        length: -7,
        lineStyle: {color: highlight}
      },
      axisLabel: {
        distance: -15,
        textStyle: {
          color: highlight,
          fontSize: '12'
        }
      },
      pointer: {
        // 仪表盘指针
        show: 0
      },
      detail: {show: false}
    },
    {
      name: '渐变标尺',
      center: ['50%', '70%'], // 默认全局居中
      type: 'gauge',
      zlevel: 2,
      radius: '95%',
      splitNumber: 0, // 刻度数量
      startAngle: 180,
      endAngle: 0,
      axisLine: {
        lineStyle: {shadowColor: 'rgba(0, 0, 0, 0.4)',
          shadowBlur: 15,
          width: 10,
          color: [[0.6, ['#1f559c']],
            [1, ['#FF5555']]
          ]
        }
      },
      axisLabel: {show: false},
      axisTick: {show: false},
      splitLine: {show: false},
      detail: {show: false},
      pointer: {show: true}
    },
    {
      name: '数值',
      type: 'gauge',
      startAngle: 180,
      endAngle: 0,
      zlevel: 1,
      radius: '63%',
      center: ['50%', '70%'], // 默认全局居中
      min: 0,
      max: 2,
      splitNumber: 0,
      axisLine: {
        // 坐标轴线
        lineStyle: {color: [[1, highlight]], // 属性 lineStyle 控制线条样式
          width: 3
        }
      },
      axisLabel: {
        // 坐标轴小标记
        show: false
      },
      splitLine: {
        // 分隔线
        lineStyle: {
          // 属性 lineStyle(详见 lineStyle)控制线条样式
          width: 0
        }
      },
      pointer: {
        // 指针
        itemStyle: {color: '#FFFFFF'},
        width: '10',
        length: '150%'
      },
      detail: {show: true},
      data: [
        {
          name: '',
          value: 1.9
        }
      ]
    },
    {
      name: '遮罩 2',
      tooltip: {show: false},
      type: 'pie',
      radius: '60%',
      zlevel: 2,
      startAngle: 0,
      silent: true,
      center: ['50%', '70%'], // 默认全局居中
      hoverAnimation: false,
      itemStyle: {
        normal: {color: function(colors) {let color = ['#14376e', '#092655']
            return color[colors.dataIndex]
          }
        }
      },
      labelLine: {
        normal: {show: false}
      },
      animation: false,
      data: [1, 1]
    }
  ]
}
原文地址: 4.9.0Echarts 巧用遮罩实现仪表盘不同指针样式
正文完


